The Retail Owners Institute® makes it easy for you to get a quick financial health assessment of your own stores, as well as the retail industry, and every vertical within it.
From farm stores to apparel stores, wine stores to tire dealers, gift shops to convenience stores; all 45 verticals.
Here's how to get started.
From farm stores to apparel stores, wine stores to tire dealers, gift shops to convenience stores; all 45 verticals.
Here's how to get started.
- Go to the Retail Benchmarks page of The ROI site.
- Scroll down the page to see the links to all 45 retail verticals.
- Choose the vertical that includes your stores; immediately go to that vertical's Benchmarks page.
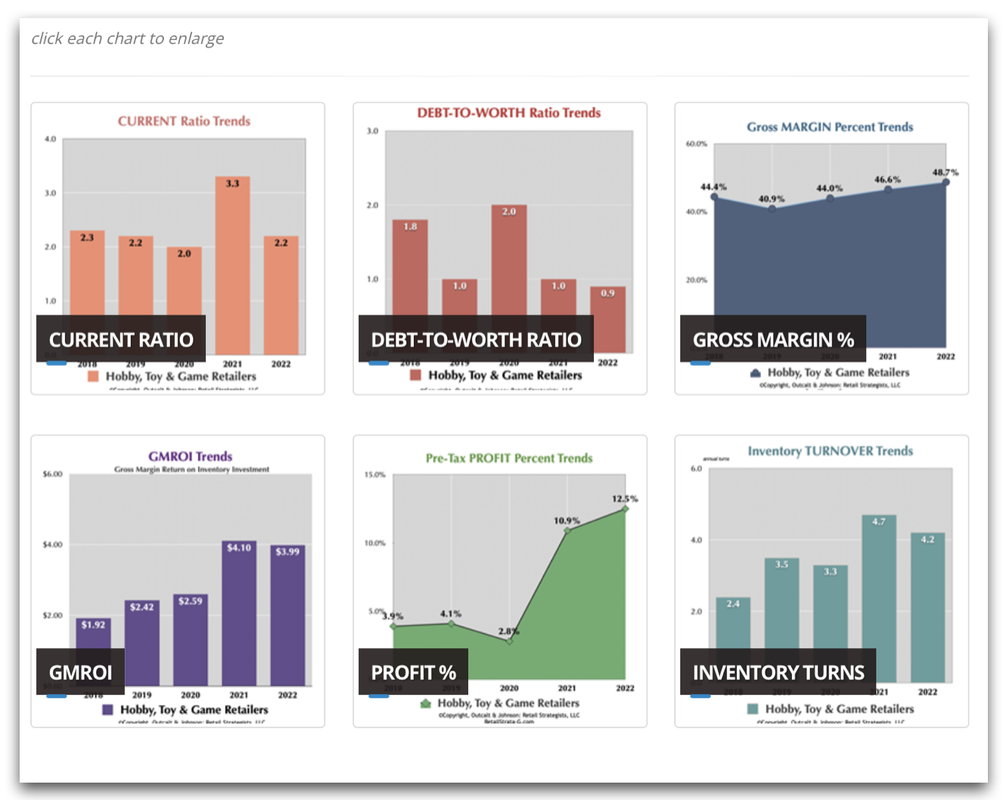
- See the results for each of 6 key ratios for the past five years. To get a better look, just click each image to make it larger.
Some reminders:
Don't stop here. See how your stores measure up! (It's free, too!)
Above Average? Find Out for Yourself
Now that you have your financial statements for 2022 in hand, it's time to use them for something other than filing tax returns!
Use the free Key Ratios Calculator on The ROI site to calculate your own ratios for your business.
Quickly find out for yourself: is our operation above average? That is, how do we compare to the Benchmarks for our retail vertical?
Just like the lab tests that your doctor requests for an annual checkup, your P&L and Balance Sheet contain the "vital signs" of your segment, or vertical.
- The source data is Risk Management Association's Annual Statement Studies. As you may know, RMA collects financial statements from banks, and aggregates the findings for all industries, not just retailing. RMA presents their data in 3 sections: the Top Quartile, the Middle Quartiles, the Bottom Quartile, for five different ranges of annual sales volume. Our Five Year Charts are based on the Middle Quartiles results.
- These verticals reflect the definitions and designations of the North American Industrial Classification System (NAICS). The top of each Benchmarks Chart page includes the NAICS code and the NAICS definition for that industry segment. (In other words, we don't make this up!)
- You may need to examine the benchmark numbers in more than one vertical to get perspective on your own store's performance, particularly if your stores do not exactly fit the NAICS category.
Don't stop here. See how your stores measure up! (It's free, too!)
Above Average? Find Out for Yourself
Now that you have your financial statements for 2022 in hand, it's time to use them for something other than filing tax returns!
Use the free Key Ratios Calculator on The ROI site to calculate your own ratios for your business.
Quickly find out for yourself: is our operation above average? That is, how do we compare to the Benchmarks for our retail vertical?
Just like the lab tests that your doctor requests for an annual checkup, your P&L and Balance Sheet contain the "vital signs" of your segment, or vertical.
- And, just like those lab results that show a range of "no need to worry" results, so too can The ROI's Benchmark charts provide perspective on how your operation compares to the average performing retailer in your segment or vertical.